


As you may know, the Feed-in Tariff solar subsidy scheme ends in March 2019.
After that, solar PV (solar electricity) has to stand on its own two feet.
The question is, can solar PV stand on its own two feet?
And more to the point, if you can’t make the March 2019 installation deadline, should you still consider solar for your own property?
Equally if you want to extend your system (which wouldn’t qualify for subsidy even if you were to extend before March 2019), should you do so?
To help you work that out, we’ve launched a brand new Solar PV Calculator...
You can access our calculator here:

All you do is enter your roof size (or ground area for ground-mounted solar) plus a couple of other details, and the calculator will work out:
- how big a system you can fit;
- the expected output from the system;
- the likely financial benefits;
- the lifetime cost per kWh of electricity generated by the system.
If, like me, you are curious to know what solar will look like in a post subsidy world, here’s a typical example:
Residential solar - example
Take a two storey new build house, facing 20 degrees off south, 36 degree slope to horizontal, local to us in Reading.
Roof dimensions as follows:
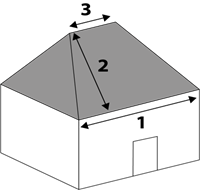 |
1: Length of bottom of roof: 8 metres 2: Distance from eaves to ridge: 5 metres 3: Length of top of roof: 8 metres |
Using standard efficiency (275W) panels measuring 1.7m x 1m (approx.), the calculator tells you that the house will fit a 5kW system, which is fairly typical for a reasonably large four bedroom house:
Optimised number of panels (standard efficiency panels): 18
System size: 4.95 kWp
|
Row |
Panels |
Orientation |
|
0 |
7 |
Portrait |
|
1 |
7 |
Portrait |
|
2 |
4 |
Landscape |
The financial benefits
The system is expected to generate 4,800 kWh in the first year, 110,000 kWh over the 25 year system life.
Assuming a daytime cost of electricity of 16p per kWh, and 50% usage on site, annual savings in the electricity bill should be around £390.
If the property has a smart meter, we are betting that there will be an electricity company out there willing to pay for export – around 5p per kWh. So that’s another £120 a year of income. (If we’re wrong on our bet, the property should look at a battery, but that requires a whole new calculator… [ watch this space 😉…])
Let’s call the first year savings / income £510 a year.
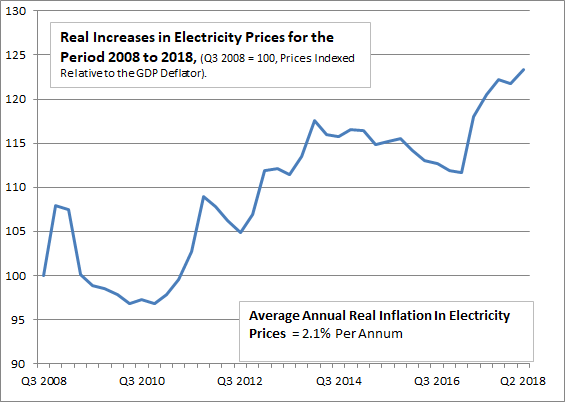
Electricity price inflation has outstripped general inflation by 2.1% a year
On average over the last 10 years, electricity price increases have out-stripped general inflation by 2.1% per annum (at the time of writing - for more recent figures, see our page on the Lifetime Cost of Solar Energy).
If these electricity price rises continue (as might reasonably be expected given that we are decommissioning 25% of our central power stations by 2025, whilst switching our cars to electric) then, in real terms, the average annual savings / income will be around £600 a year.
The system cost for a new build will be around £5,700 so that’s a 10 year payback. Versus a system life of 25 years.
Lifetime cost of electricity
In simple terms, the cost of the electricity produced by the system would be 5p per kWh.
The cost of the electricity actually used on site (once export income was taken into account) would be around 8p per kWh.
This is well below the current cost of domestic day time grid electricity.
The conclusion?
- Of course, if you can install solar before March 2019 and claim the subsidy, you should. On the system above you’d get an extra £185 income per year if you could claim the Feed-in Tariff. A lifetime increase of around 33% in the return.
- But if you can’t beat the March 2019 deadline, don’t panic. With the lifting of EU Import Tariffs on solar panels, and the on-going improvements in panel efficiency, the price of solar panels has fallen sufficiently far for solar to make sense on its own…
- Payback times at the domestic level without tariffs are in the order of 10-12 years, against an expected system life of 25 years. And the lifetime cost of electricity generated and used on site will be in the region of 9p per kWh - compared to the expected average cost of grid electricity over the system life of 42p / kWh.
- It is always cheaper to install on a new build property than to retrofit, so new builds really ought to include the technology if the property has a decent roof.
Of course you don't have to work out the returns yourself. We are always happy to do a free desk-top quote for you, to give you an idea of what returns you can get from a solar system and / or a solar PV system. Just call us on 0118 951 4490, email us on info@spiritenergy.co.uk, or fill in our online form:

The results in full
For completeness, here are the full results for the example above.
| System Performance | ||
| Estimated System Size | 5 | kWp |
| Estimated System Output in First Year | 4,800 | kWh |
| User Inputs: On-Site Usage and Tariffs | ||
| Proportion of Generated Electricity Used on Site | 50 | % |
| Proportion of Generated Electricity Exported | 50 | % |
| Daytime Electricity Tariff | 16 | p / kWh |
| Export Tariff | 5.0 | p / kWh |
| Average Annual Income & Savings | ||
| Estimated Average Annual Savings on your Electricity Bill (from solar electricity used on site) | £460 | |
| Estimated Average Annual Income from Export of Excess Electricity | £140 | |
| As you have entered that you have or expect to have in place half-hourly metering or smart metering, we expect (but cannot guarantee) that you should be able to earn income from excess solar electricity exported to the Grid. | ||
| Total Average Annual Income & Savings | £600 | |
These estimates are based on your current tariff of 16 p / kWh and calculated over the 25 year system life in real terms by assuming electricity price inflation will exceed general inflation by 2.1% per annum (as has been the case historically – see chart above). |
||
| Estimated System Cost | ||
| Estimated Cost of System (excluding VAT) | £5,700 | |
| Since this system would be installed as part of a new-build, we have assumed that scaffolding would already be in place so we wouldn't need to include this in the system cost | ||
| Applicable VAT Rate on this System | 0 | % |
| Estimated Cost of System (with 0% VAT) | £5,700 | |
| Lifetime Benefit Analysis | ||
| Estimated System Life | 25 | years |
| Subject to expected inverter replacement after around 13 years. | ||
| Expected Lifetime Output | 110,000 | kWh |
| Estimated Payback Time | 12 | years |
| Environmental Benefits | ||
| Lifetime Reduction in Carbon Footprint (C02 emissions) | 57 | tonnes |
| Equivalent Mass of Coal Saved | 350,000 | kg |
| The mass of coal that would be required to generate the electricity your system would output in its lifetime. Source: https://www.euronuclear.org. | ||
| Solar Electricity Costs | ||
| Lifetime Cost per kWh Generated by System | 5 | p / kWh |
| Lifetime Cost per kWh Used on Site | 8 | p / kWh |
| Takes Export Income into account. | ||
| Expected Grid Electricity Cost For Comparison | ||
| Expected Average Real Cost of Grid Electricity per kWh over System Life | 21 | p / kWh |
| Assuming 2.1% real annual inflation in electricity prices. Based on your current tariff of 16 p / kWh. | ||


