


Over the past year there have been a couple of fairly large changes which have impacted the payback period of a solar PV installation. Firstly the Feed-in Tariff (FiT) closed for new applicants at the end of March 2019 and then the Smart Export Guarantee (SEG) was brought into effect at the start of this year.
The cost of an installation has fallen, while the efficiency of panels has improved dramatically over the past 10 years. This means that a system installed today would displace more grid energy required, helping to improve grid independence and causing a greater reduction in energy bills.
If your solar PV system was installed before the end of the FiT you will still receive payments of 50% deemed export and paid per unit of generation. This blog, however, will explore the solar panel payback period for a system installed on a domestic property after the closure of the FiT.
How does the solar PV payback period vary?
For the fastest payback period, you need to maximise the amount of solar generation used on site, rather than being exported to the grid.
Octopus Energy currently offers the best export rate, under the SEG, of 5.5p/kWh. Electricity is imported from the grid at approximately 22.36p/kWh. The electricity that is generated by your solar PV system is therefore worth about three times more if used directly on site rather than being exported back to the grid.
For 100% on site usage, the loads or energy requirements of the property always need to match or be greater than the PV generation. However, this is very unlikely to happen unless the energy requirements are very large and the PV system is undersized.
The payback period is therefore dependent on the property’s load profile and energy requirements, but how much difference do they actually make?
How much of the day are you at home?
If you are out all day, your load profile is expected to have a spike in the morning and evening and have fairly low requirements during the middle of the day.
If you are at home the majority of the day, it is likely that your energy requirements will be more constant.
These variations in energy requirements can have a big impact on the on site usage of PV generation and therefore alter the financial returns. The table below details the expected performance, first year annual benefits, and payback period for a ‘standard’ system assuming different load profiles.
|
Home all day |
In half the day |
Out all day |
|
|
On site usage |
37% |
29% |
17% |
|
Load covered by PV |
30% |
24% |
14% |
|
Energy savings |
£203 |
£159 |
£93 |
|
SEG payments |
£115 |
£130 |
£152 |
|
Total annual benefits |
£318 |
£289 |
£245 |
|
Payback period |
12 years |
13 years |
14 years |
The system modelled consists of 12 x 310W panels which is expected to generate 3,660kWh if facing due south and pitched at 10 degrees. The cost of the system is £5,500 and the annual electricity usage of the property is 4,500kWh/year. The energy savings are the expected first year annual benefits as the rising cost electricity ought to be taken into account for the annual benefits after year one. The payback period takes into account an assumed electricity inflation rate of 7% and a panel degradation rate of 0.7%. The figures for on site usage are taken from the MCS guidance MDG-003.
While it clearly takes a significant time to pay back the initial installation cost, a solar PV system is expected to last a minimum of 25 years. In fact, some of the earliest systems installed in the 80s are still running!
It should be noted that the payback periods have been calculated using a number of assumptions and unfortunately we aren’t able to predict what electricity prices will do over the coming years, but the recent trend has seen prices increase by 7% each year.
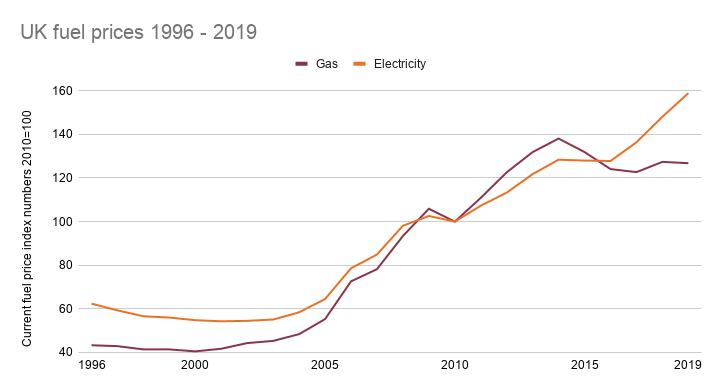
Source: BEIS.
If installing solar, it would be wise to load manage more effectively (e.g. turning on the washing machine when solar generation is high) to help increase your on site usage. If you consciously shift some of your higher energy demand loads to the middle of the day (using timers and smart devices where possible), this should see your load covered by PV increasing and the payback period decreasing.
Impact of electric vehicles on payback period
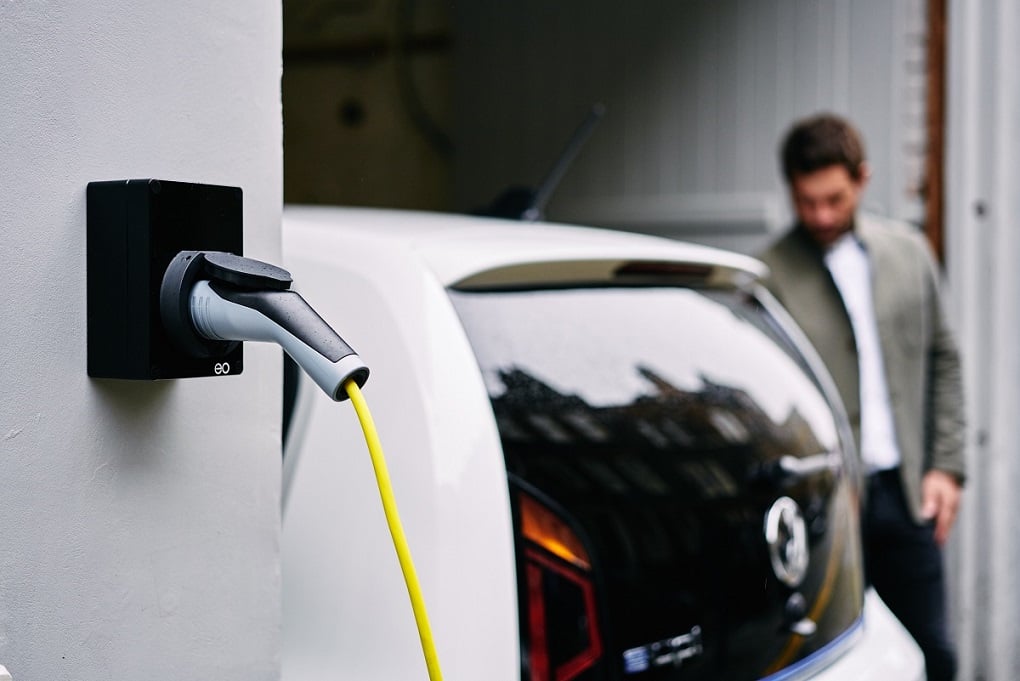
It is also expected that the number of homes with electric vehicles will increase significantly over the coming years as the government looks to ban the sale of new petrol and diesel cars within the next 15 years. This could add in the region of 2,000 - 3,000 kWh per year to a home’s energy requirements for each vehicle.
If you are able to charge the vehicle at home when there is solar generation, this will have a large impact on the payback period of your solar PV system. The zappi EV charger has dedicated ECO modes which allow the vehicle to be charged only from excess solar generation if plugged in, further decreasing reliance on grid energy and increasing on site usage of PV generation.
Environmental payback of solar panels
While the financial return is often the main payback period which is focused on, the other payback period which should be considered is the environmental payback. There is a common misconception that the time taken to offset the CO2 emissions produced during the manufacturing process takes the majority of the solar panels’ lifespan.
In northern Europe, it is estimated that the environmental payback is 2.5 years, whereas it is only 1.5 years in southern Europe where solar generation is higher. The environmental payback has improved over recent years and this is largely due to increased cell efficiencies and thinner wafers and wires, which require less material.
Find out more
Get a quick estimate for the payback of a solar system at your property by using our free calculator: