


In the old days of solar PV, after your system was fitted, the only way to know how much power you produced was from the generation meter ticking up each day, or reading the screen on the inverter.
As inverters got better and integrated with WiFi, they allowed you to track daily, monthly and yearly production figures using your phone or computer. Although, one thing that you could never be sure of is the total amount of PV energy consumed on site.
But times have changed, and there are now much better ways of monitoring solar export and self consumption.
From the FiT to the SEG
When it is sunny, PV will power on site loads. But for people without a battery, if you generate too much electricity, this will be exported back to the grid and sold. With the old Feed-in Tariff, this was deemed at 50% of your production and never measured. This means unless you fitted a dedicated export meter, or have a clever battery such as Powerwall tracking usage in your house, you are never sure exactly how much of your own generated energy you use or export back to the grid.
This matters because each kWh you use at home saves you around 22.36p/kWh off your electric bill, but the best export payment is only around 15p/kWh. This means it generally makes sense to prioritise on site consumption, then export.
Now that the FiT has ended, instead of an assumed 50% export payment, you are able to be paid a market rate of around 15p/kWh for the energy you actually export under the Smart Export Guarantee. This measured payment is all thanks to SMETS2 smart meters, which are able to track usage and export and allow you to swap electricity supplier without needing a new meter fitted.
Viewing solar export data
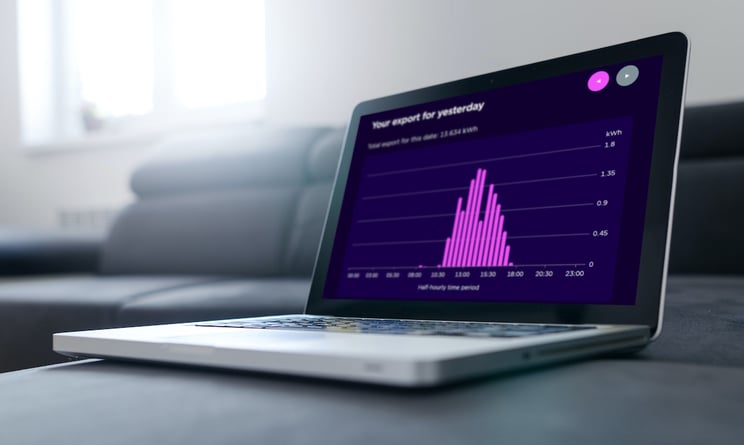
What does this look like? Below you can see Octopus Energy’s latest tool. (For background info, see the details and stats behind my 4.2 kWp SunPower system.)
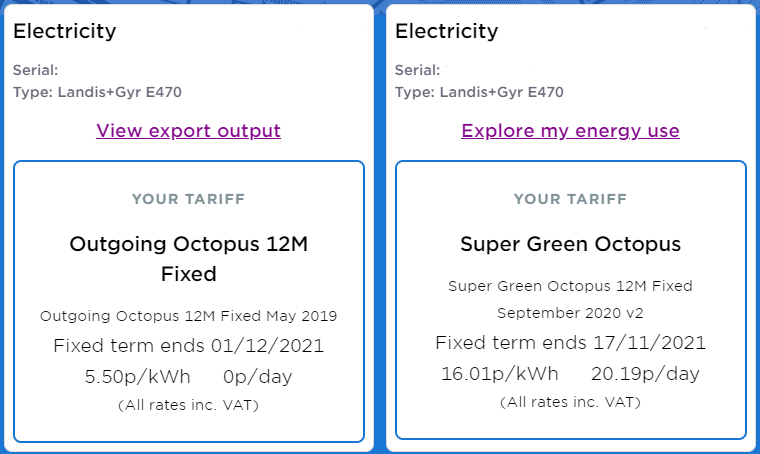
First you can login to your online account to see the tariffs you are on for electricity, gas and electricity export:
Then as well as seeing some headline figures for each week, you can start looking at daily, weekly or monthly export readings. You can see exactly what was exported from a half hour slot in the day, to total annual production.


You can then pair this up with half hourly consumption readings to understand when you use (and export) the most or least amount of energy each day, month or year:


You get exactly the same consumption readings for gas too.
This is all really for your own knowledge, as any export is automatically tracked and credited to your account the following month.
Solar self consumption
So if you wanted to work out that all important on site consumption figure, now you can! Just subtract the total measured export from the generation total provided by your inverter or smart meter.
For me in 2021 that’s:
- Production Jan - May: 1,700 kWh.
- Export Jan - May: 1,254 kWh.
So total PV energy export for just under half of the year is a fraction below 74%. That means there may be a case for me to get a battery or an electric car!
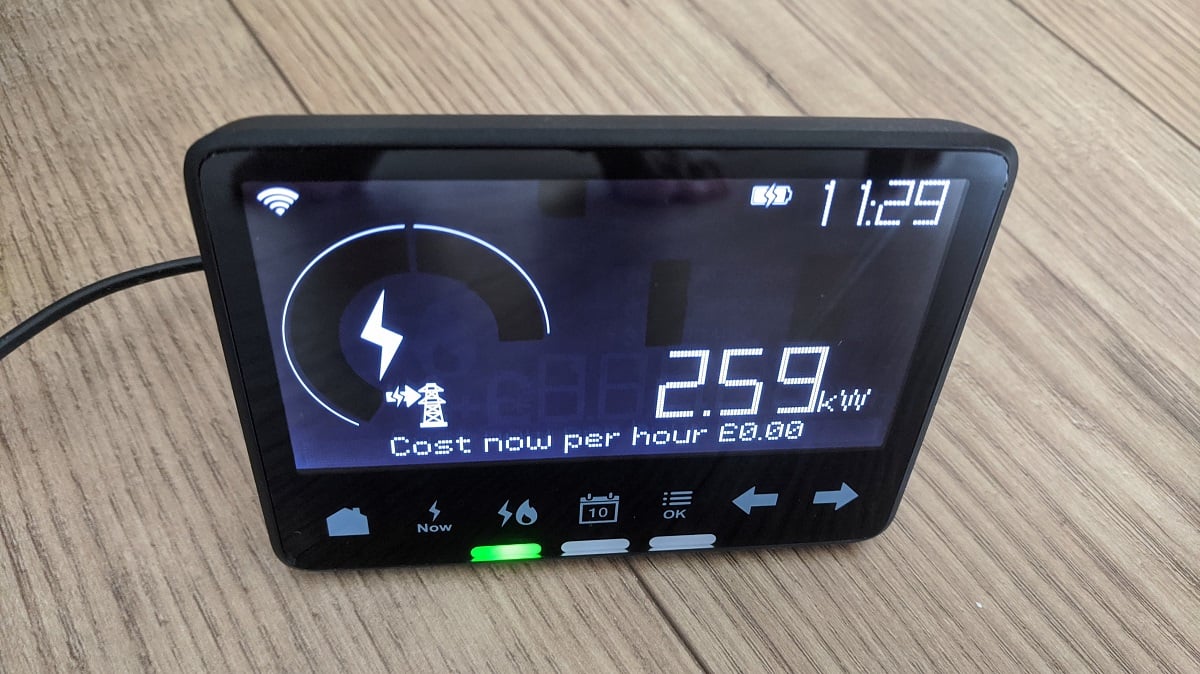
Smart meters normally have a smaller device in the kitchen which relays live production / consumption figures too. This is useful because if I see the little pylon symbol with the green light, I know I should switch on devices now as they will be powered from the PV system. If it’s red - I should try to switch things off!
Going further
Finally, you can do even cleverer things using Octopus’ Open API rather than just reading the dashboard figures.
Among other things, this lets you take advantage of half hourly agile rate tariffs, which can make sense if you have Powerwall installed or an electric car parked on your drive.


